Top Aquaculture producers worldwide

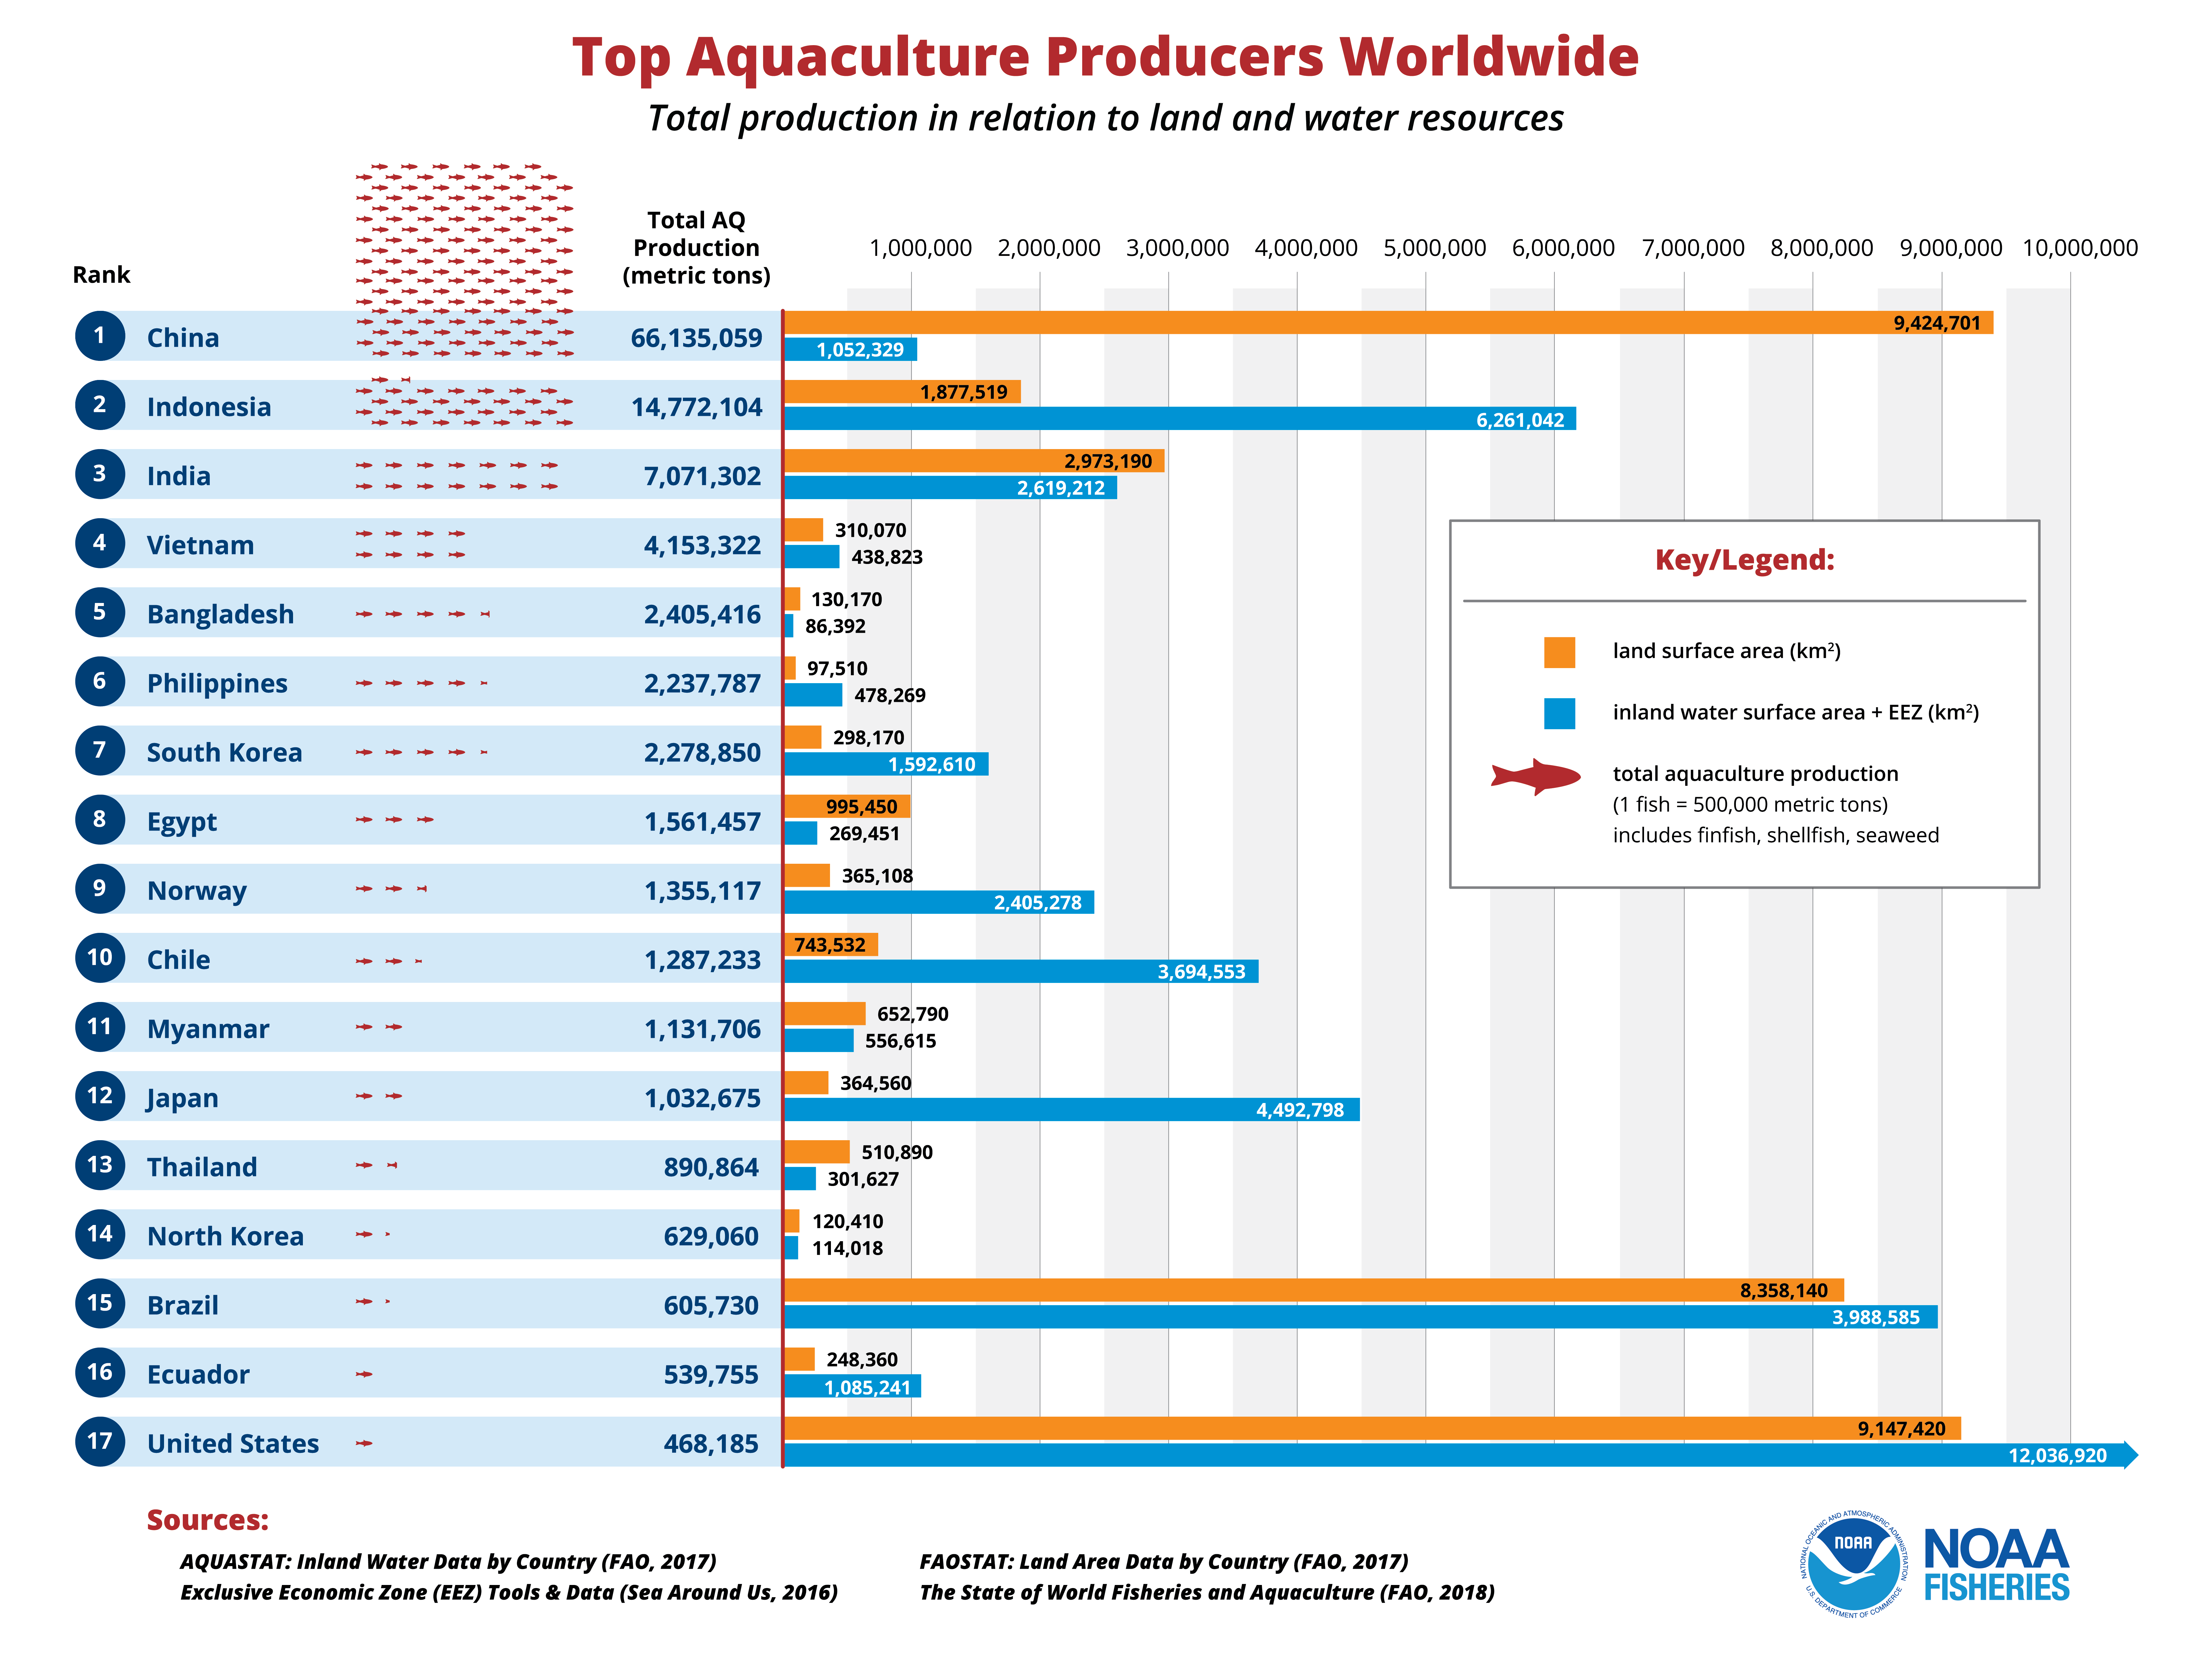
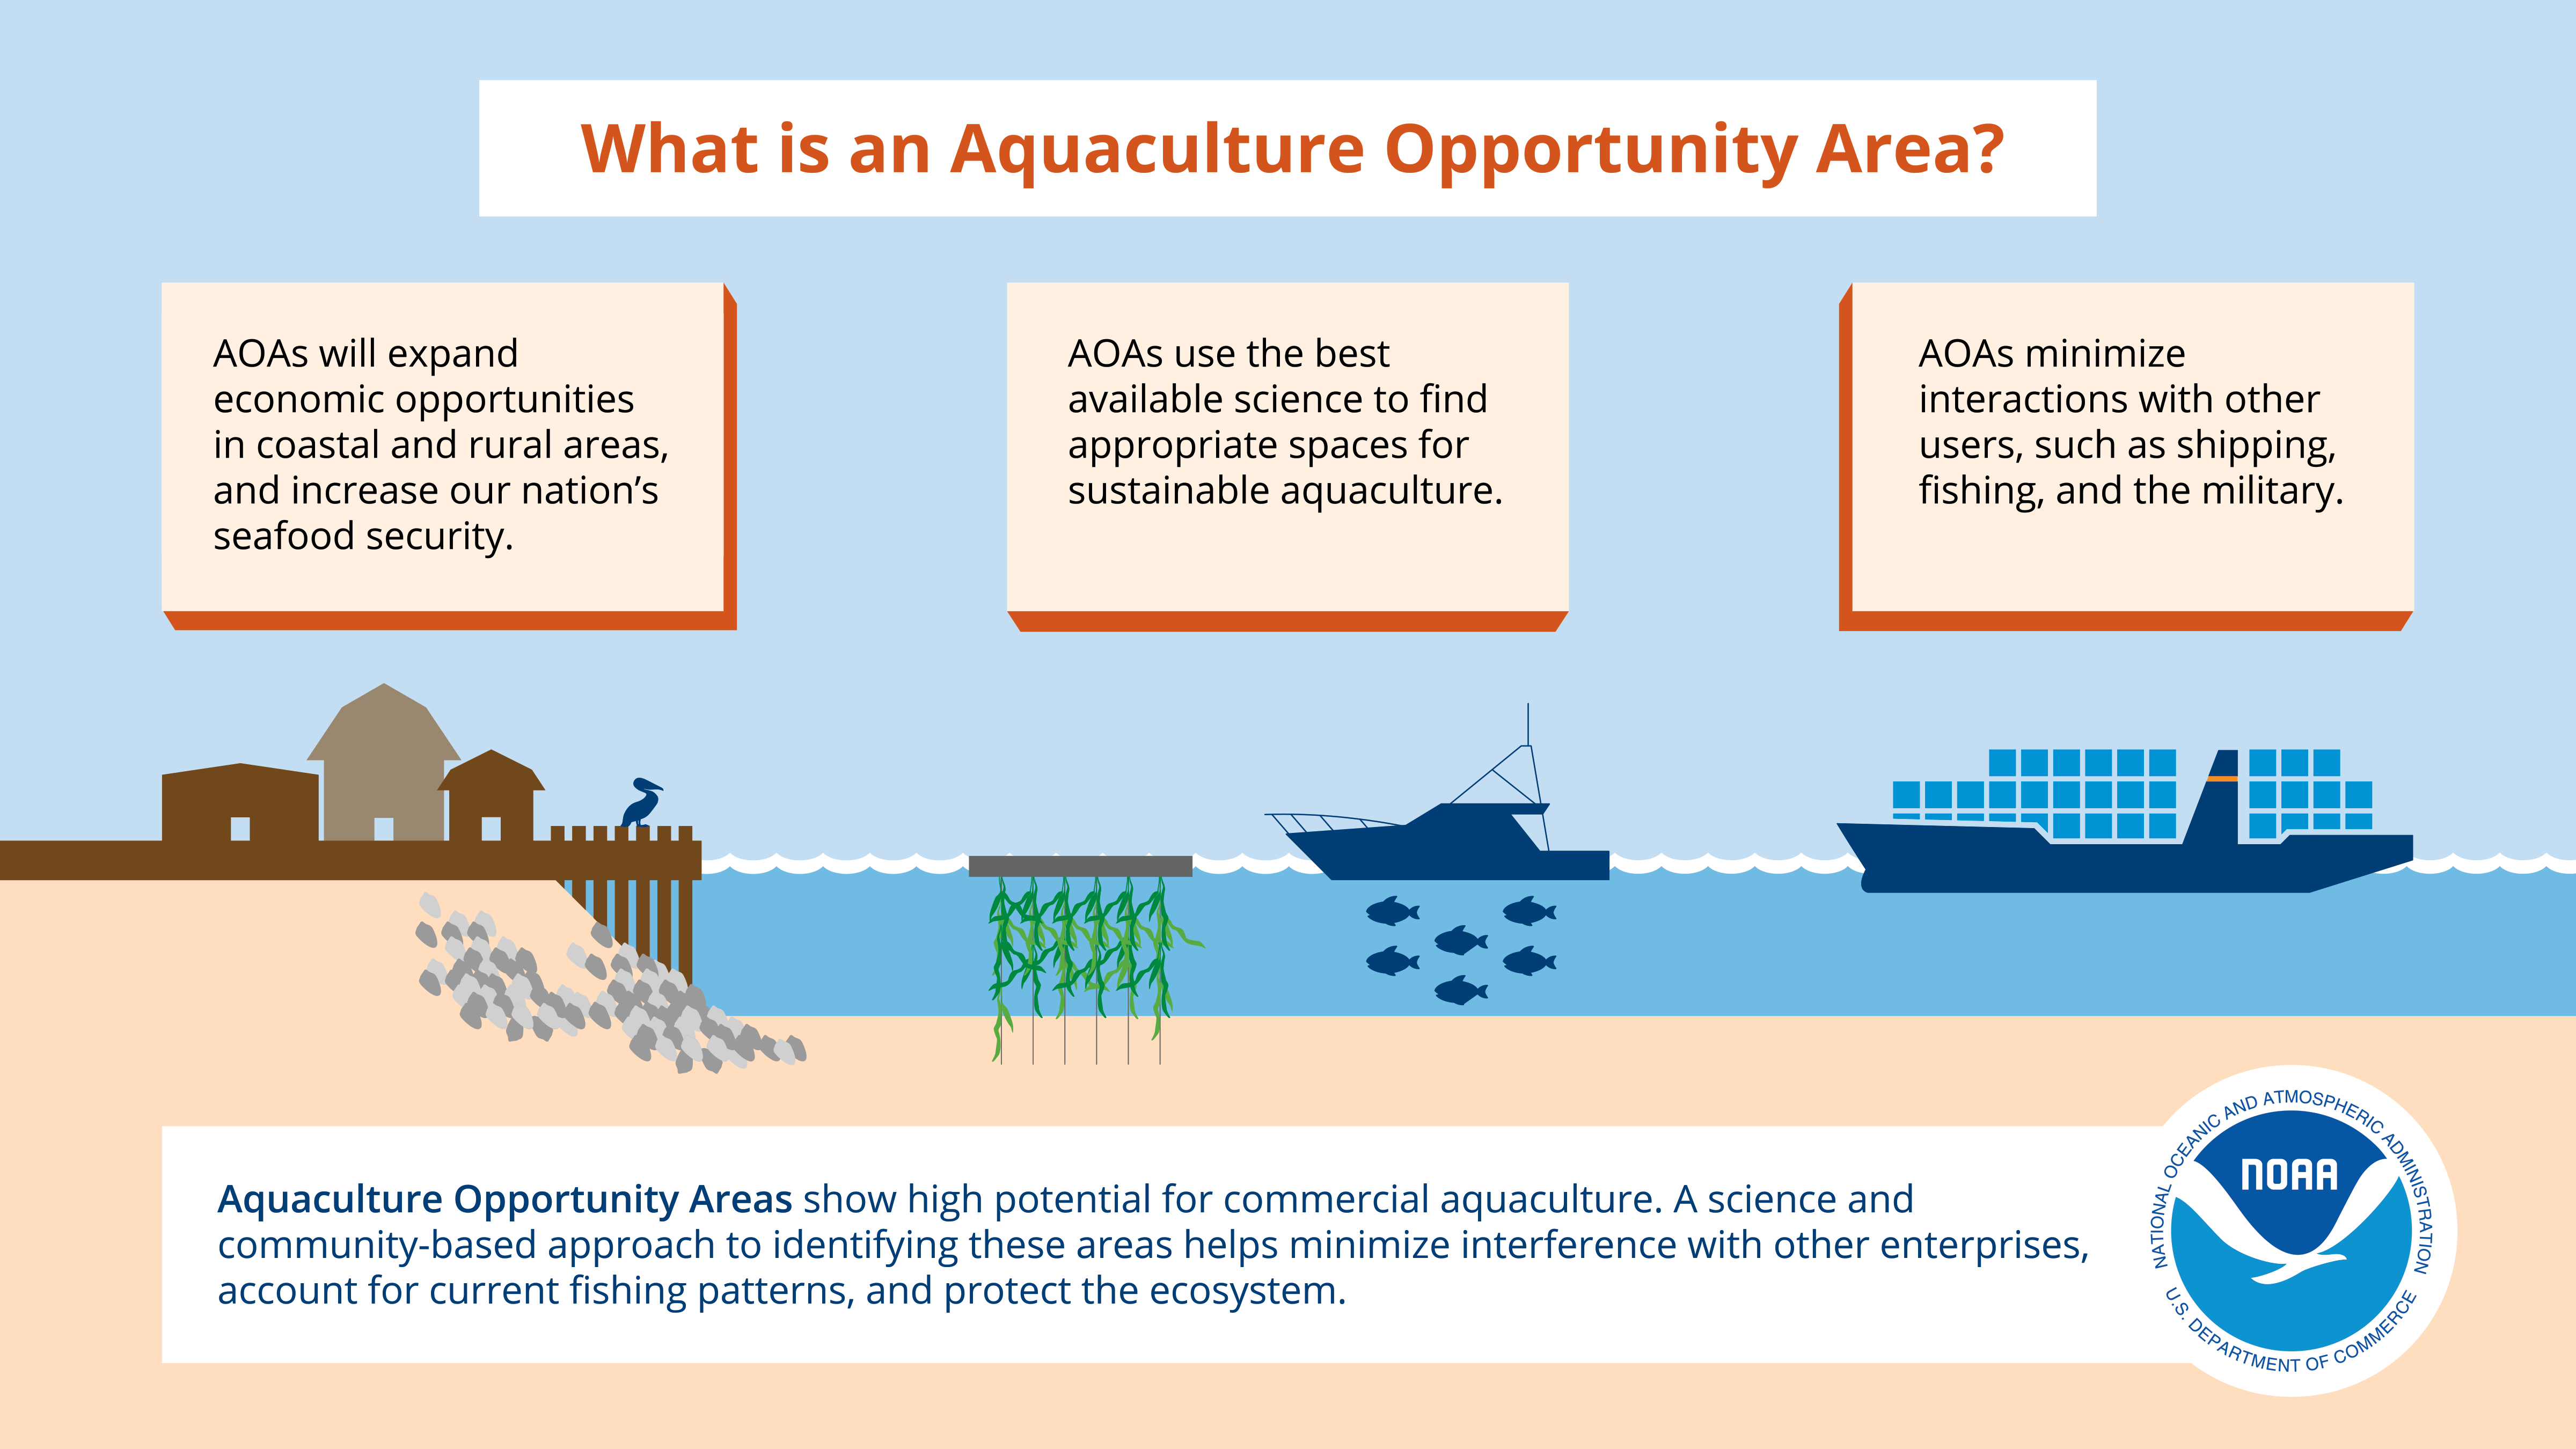
Although the United States has the land and water resources to significantly increase its aquaculture industry, our current production puts us at number 17 on this list of top global producers. I collaborated with the NOAA Fisheries Office of Aquaculture’s science team to gather data in order to make this design.

“Top Aquaculture Producers Worldwide” infographic.

Fostering Diversity and Inclusion in Aquaculture

I created these infographics to accompany a NOAA Fisheries Office of Aquaculture featured news story, “Fostering Diversity and Inclusion in Aquaculture.”

“In 2016, women earned about half of all science and engineering bachelor’s degrees; underrepresented minority students earned 22%.”
“In the field of fisheries science in the United States, only one in four faculty members or scientists is a woman. Just one in ten is a person of color.”

Aquaculture Opportunity areas

Aquaculture Opportunity Areas are small, well-defined geographic areas that have been evaluated to determine potential suitability for commercial aquaculture. Introduced in 2020, I made the following infographics to illustrate this new concept.

“What is an Aquaculture Opportunity Area?” general infographic.
“What is an Aquaculture Opportunity Area?” presentation slide.
“Assessment of Potential Aquaculture Opportunity Areas” steps infographic.

Ocean Acidification and Aquaculture

It has been a while since I blogged anything (I blame COVID). But, I swear I am going to start adding my infographics from NOAA Fisheries to the site.

Here is one that I finished recently, ‘Ocean Acidification and Aquaculture.’ It will be used in an upcoming report about the effects of climate change and ocean acidification on marine aquaculture.

“Ocean Acidification and Aquaculture,” a report infographic.