Water treatment cycle poster

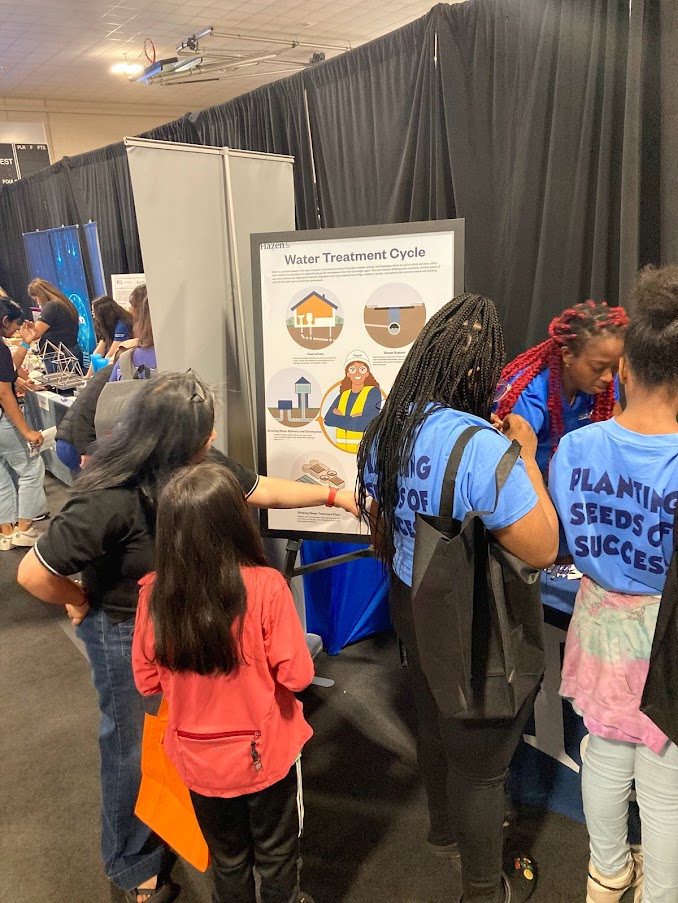
I recently finished this movie theater-sized water treatment cycle poster for my employer’s booth at the “Introduce a Girl to Engineering” K-12 career expo. The poster educates young readers about the path water takes to reach our homes, schools, and businesses, and sparks conversations about engineering careers. I’m currently working at Hazen and Sawyer, an engineering firm that addresses water supply and water quality challenges.

This project scratched an itch for me by combining my interests in writing and illustration. I worked closely with Hazen engineers and recruiting specialists to refine their text and build the 24×36″ design. I drew each illustration individually before arranging the final poster layout in one massive Adobe Illustrator file. We were on a tight deadline but completed the project in time to print and frame it before the career expo.

The Water Treatment Cycle poster shows six large icons in a chronological circle, surrounding a young engineer with her arms crossed proudly in a high-vis vest and white Hazen helmet. The steps/icons are: Point of Use, Sewer System, Wastewater Treatment Plant, Water Source, Drinking Water Treatment Plant, and Drinking Water Delivery and Conveyance.
Engineers in the water industry help design, construct, operate, and maintain safe drinking water to protect the public and our environment.
A photo of my Water Treatment Cycle poster in use at the conference. A Hazen engineer is pointing at the poster and describing it to an interested student protege, an elementary-aged girl in a pink backpack.
Planting seeds of success. Hazen engineers used the poster to introduce and describe the importance of the water treatment cycle to future colleagues from K-12 schools.
The "Introduce a Girl to Engineering" logo on a banner with multiple flowing outlines of women moving across the banner.
If you have the expertise and time to volunteer, get involved with “Introduce a Girl to Engineering!”

Top Aquaculture producers worldwide

Although the United States has the land and water resources to significantly increase its aquaculture industry, our current production puts us at number 17 on this list of top global producers. I collaborated with the NOAA Fisheries Office of Aquaculture’s science team to gather data in order to make this design.

“Top Aquaculture Producers Worldwide” infographic.

Fostering Diversity and Inclusion in Aquaculture

I created these infographics to accompany a NOAA Fisheries Office of Aquaculture featured news story, “Fostering Diversity and Inclusion in Aquaculture.”

“In 2016, women earned about half of all science and engineering bachelor’s degrees; underrepresented minority students earned 22%.”
“In the field of fisheries science in the United States, only one in four faculty members or scientists is a woman. Just one in ten is a person of color.”

Aquaculture Opportunity areas

Aquaculture Opportunity Areas are small, well-defined geographic areas that have been evaluated to determine potential suitability for commercial aquaculture. Introduced in 2020, I made the following infographics to illustrate this new concept.

“What is an Aquaculture Opportunity Area?” general infographic.
“What is an Aquaculture Opportunity Area?” presentation slide.
“Assessment of Potential Aquaculture Opportunity Areas” steps infographic.

Ode to Grumpy Cat

Starting my master’s degree this year has turned me into a frequently fatigued juggler of tasks, but sometimes I still design things just for fun. I drew this in Adobe Illustrator last summer after I was simultaneously inspired by Grumpy Cat and a solar-powered, paw waving, Good Luck Cat that I picked up in Chinatown.

I spent five hours doing stats homework today; I needed to express myself somehow.

Good Luck Grumpy Cat